
 Autor: Ryuma Nakano
Let's consider data as the fundamental and simplest input in the field of analytics. However, understanding and managing it are not simple tasks. On the contrary, each piece of data possesses intrinsic characteristics and properties that allow us to leverage them to the fullest extent. Yet, in some cases, they also impose limitations.
¿What are data?
How should we manage them?
From its purest definition, data is a symbolic representation of a quantitative or qualitative attribute or variable. But what does this mean? Essentially, data is a set of alphanumeric characters (letters and/or numbers) that represent values, words, expressions, dates, classifications, ratings, and various abstractions we encounter in our daily lives. Nowadays, even videos, images, photos, and songs are also part of the world of data, although we will explore these aspects in future chapters, as their definition and treatment differ from our initial notion.
Delving into the subject, do we truly understand the types of data we use daily, or do some remain unnoticed due to their everyday nature? We can categorize data into three main groups. The first encompasses data consisting of characters and numbers representing descriptions, such as 'tall', 'low', 'red', or 'blue'. These are known as strings or text. The second group involves numerical values, whether integers or decimals, like temperature, total sales, or height. The third group includes dates, which are representations of strings for sequences of days. Distinguishing between these types of data is crucial to comprehend their impact on storage systems, a topic we will explore in future articles on databases.

Once we understand the basic types of data, we can explore their classifications and properties, which are divided into two major groups:
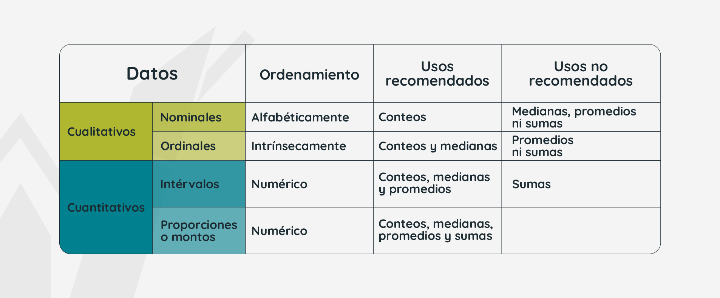
Qualitative: Mostly, these are text-based data, although in some cases, they can be numbers representing properties of the object of study, such as an identification number. In this group, we find two categories:
- Nominal: Most of the data we store is of this type, describing our object of study in a textual manner. Examples include the object's name, identification, color, etc..
- Ordinal: These are text-based data that contain an intrinsic order, such as geographic locations, sizes, or positions on a podium.
Quantitative: These are mostly numerical data, upon which we can conduct deeper mathematical and statistical analysis. This group is divided into two categories::
- Intervals: Numerical data that allow most mathematical operations, preserving their logic but not allowing addition between them. Examples include grades, dates, time, height, latitudes, and longitudes.
- Ratios or Amounts: Perhaps the most crucial data, as they allow any type of mathematical operation without losing their meaning. Common examples include sales, costs, losses, grades, and temperature.

Understanding the diversity and nature
of data is essential to harness their full potential and make informed decisions in the complex world of analytics. In future installments, we will delve deeper into the influence of this data on storage systems and its role in strategic decision-making.
The following graph will help us better understand the data groups and their classifications
Did you know this about Data?