
 Autor: Juan Pablo Rey
Autor: Juan Pablo Rey
Autor: Juan Pablo Rey
Graphs, or graph theory, is a branch of mathematics and computer science
where, with the help of discrete mathematics, we can draw and explain
this type of data or "graph".
Example of a Graph
Now, you might wonder about those points and lines we see in the previous figure. At first glance, it may seem like a simple geometric figure or a drawing made by a person. However, what is not immediately obvious is that those points are called EDGES and the lines are called VERTICES, which we will explain further:

Edges:
These are the lines that connect the vertices of a graph.
Adjacent Edges:
Two edges are adjacent if they converge at the same vertex.
Parallel Edges:
Two edges are parallel if their initial and final vertices are the same.
Cyclic Edges:
Edges that depart from a vertex to enter the same one.
Crossing:
Point where two edges intersect.
Vertices:
Now, with that insight into graphs, we begin to understand how they transform from a scribble or a simple drawing into a materialization of mathematical relationships.
Path:
Now, with that insight into graphs, we begin to understand how they transform from a scribble or a simple drawing into a materialization of mathematical relationships.
Now, you might be wondering how this fits into the world of data or how it can affect you if you want to enter this field. Well, for starters, we have a perfect example right in front of us, and yes, I'm talking about social networks, which rely heavily on graph theory for many of their functions, as our "followers", "friends", and others are the nodes of our network.
Ahora bien, te estarás preguntando esto como entra en el mundo de los datos o como esto puede afectarme si quiero entrar a este mundo. Pues para empezar tenemos un ejemplo justo en las narices y no nos hemos dado cuenta, y si, hablo de las redes sociales, las cuales basan mucho de sus funciones en teoría de grafos, ya que nuestros “followers”, “amigos” y demás, son los nodos de nuestra red.
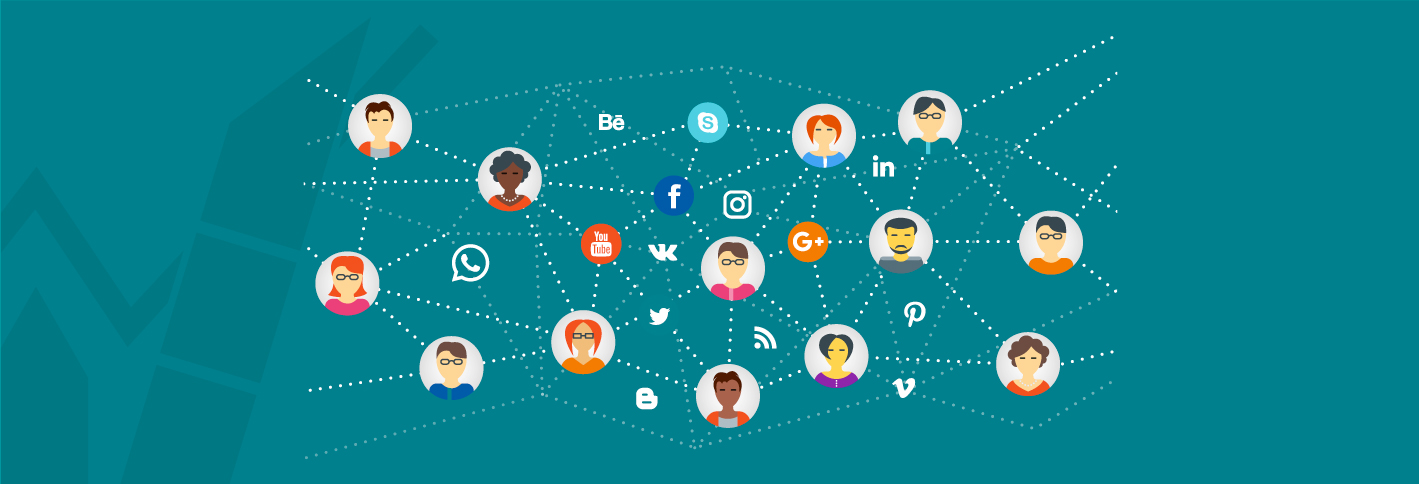
As seen in the image above, we observe how all these people are connected by lines (what we already know are Edges) and the people are our vertices.
But you may ask, how does this affect me or the world of data? Well, in a very interesting way, as graphs can be data structures just like their vertices. This is because in Python, we can give them these structures to operate on this graph. But what good is it to operate on this? Well, that's where we come in as interested parties, engineers, marketing specialists, etc... Because we can see the behavior of people, campaigns, posts, and more through this graph. A very clear example of this is the people who follow someone specific, like a celebrity, a brand, an influencer, etc. This gives us invaluable information when it comes to carrying out advertising campaigns or marketing plans, as we have target audiences, things that were previously obtained by knocking door to door, making calls, or conducting surveys. Nowadays, by looking at these networks, we can obtain the information we want from the people who belong to them.
In summary, graphs have revolutionized the way we handle our connections or social networks, due to their way of managing this information and materializing it. This is just one of the many applications of graphs to the world of data and is one of the most "famous," but at the end of the day, we see how everything fits into the world of data.
Can Graphs Aid in Data Analysis?